It’s freezing outside. Literally, there’s literally a blizzard, and Boston is shut down. Appropriately, I made a thermometer last week.
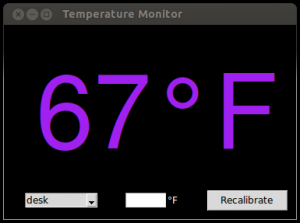
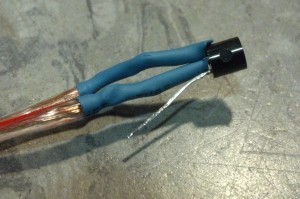
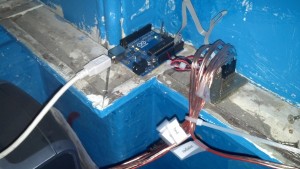
67°F in a blizzard? Actually, it’s a thermometer for my room. It consists of an array of LM335Z temperature sensors that I’ve distributed around my room. Each sensor has wires leading back to my Arduino, and the Arduino is connected to a USB port on my desktop.
I used Python to talk to the Arduino over serial. Then, I created a module for reading the temperature from a sensor on a pin on the ‘duino. I created a temperature object for storing temperature values in a way easy to convert between absolute temperature in Kelvin and temperature in degrees Fahrenheit as well as other representations.
In the sensor-reading module, I also included a method for calibrating each sensor with a list of known values. Then, when the sensor is called to give a reading, the method makes a linear regression of the calibration values and uses the regression to correct the new reading. I used the numPy module to implement a least squares linear regression. I also used the pickle module to serialize these calibration points and save them to a backup to avoid re-calibrating between program restarts.
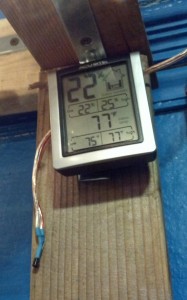
To gather calibration points, I’ve been leaving a digital thermometer by each sensor and regularly submitting readings from that thermometer to my program using the user inputs at the bottom of the screenshot at the top of the post. In the window, the first input is a menu to select a sensor by location; the second is a box to type in the true temperature; and the third is a button that takes the true temperature along with the current reading from the selected sensor and saves them to the list of calibration points for that sensor.
I’m concerned that my off-the-shelf digital thermometer is not very accurate, so I’m going to borrow a better thermometer soon, but I also hope to remove some precision error by data averaging. Also, I suspect a linear regression may not be ideal for calibration–as you can seem below, a quadratic regression fits much better, for example.
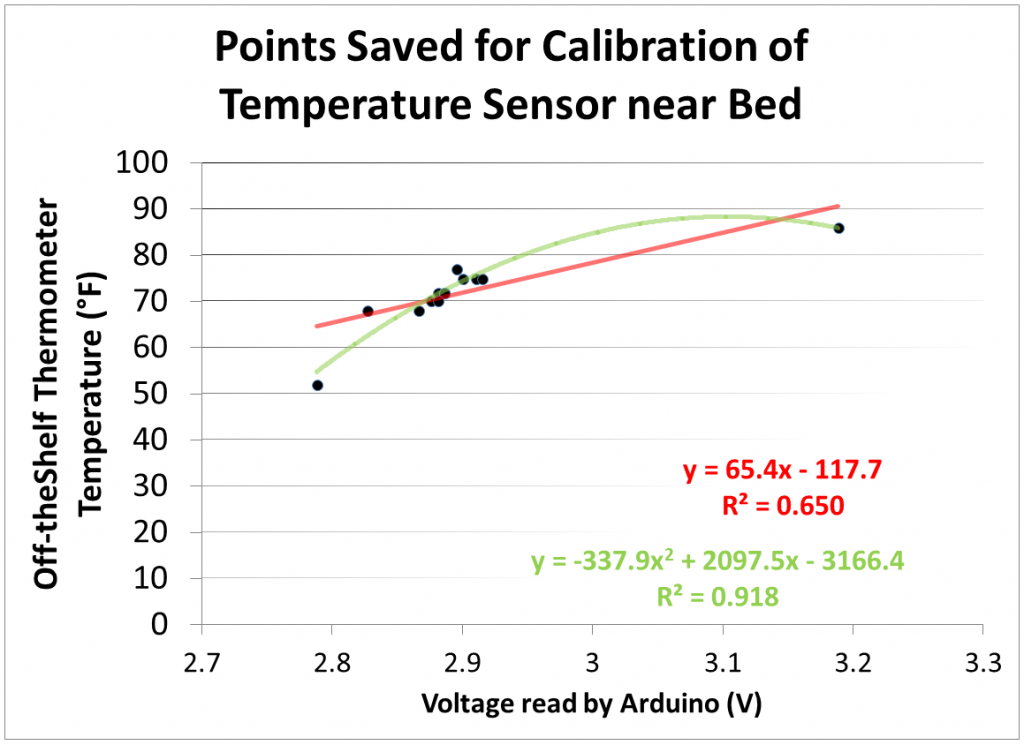
Several calibration data points for a sensor produced this graph, overlaid with a linear regression (red) and a quadratic regression (green).
At the top level, I’m averaging the readings from all the sensors and displaying them in a UI that I made with the tkinter module. I mentioned the calibration button earlier; the large number above it is the average temperature from the sensor. For now, I’m also printing the reading off every sensor to a terminal. In the future, I plan to display a weighted average of the temperature based on places I’m likely to be–weighting my desk and bed heavily, for example. Better yet, weight the reading dynamically based on where I currently am in my room or where I am likely to be in the near future. I also plan to add more sensors.
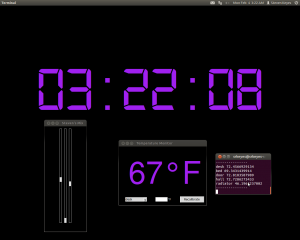
The radiator temperature seems incredibly low for a radiator because my radiator was turned off and is adjacent to the window, which is very cold.
One thing that surprises me is how fast these sensors respond to changes in temperature. The temperature read off one instantly changes a few degrees upon touching it with a finger. Yet, when untouched, they don’t vary by more than half a degree for several minutes.
Next, I want to make a controller for my radiator and add it to the system. I’ll also update you on the MASLab robot I worked on last month. Also, I started using github, which is nice.
